What does Analytics & Reports do?
Analytics & Reports helps HR and People Ops teams plan, manage, and measure employee experience workflows inside VyBeing.
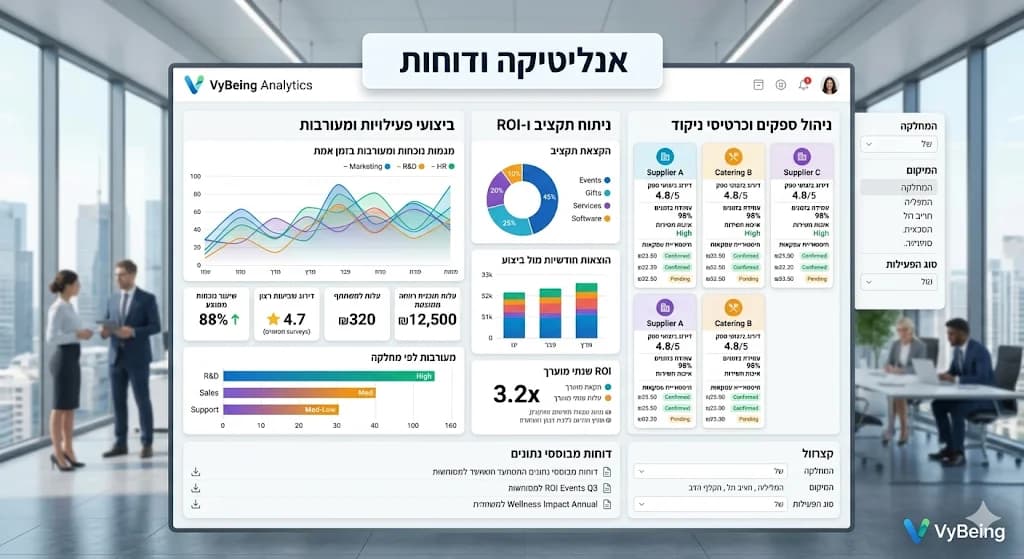
Event performance metrics, vendor analytics, budget insights, ROI analysis, and custom reports.
In short
Event performance metrics, vendor analytics, budget insights, ROI analysis, and custom reports. This page explains how the feature fits into the broader VyBeing workflow and how teams can connect it to planning, vendors, control, and execution.
Transform execution metrics into board-ready business intelligence with Analytics & Reports. VyBeing aggregates financial transactions, event RSVPs, employee attendance rates, vendor performance scores, and post-event survey data into real-time visual dashboards. Filter reports by department, location, or program category to isolate trends and demonstrate workplace culture ROI to executive leadership. Export raw files, scheduled PDF summaries, or secure read-only dashboards for stakeholders.
Analytics & Reports helps HR and People Ops teams plan, manage, and measure employee experience workflows inside VyBeing.
It is built for HR, People Ops, and employee experience teams that need better control over vendors, budgets, approvals, and execution.
The feature works alongside AI Planner, vendor discovery, budget workflows, execution tracking, and reporting so teams can move from planning to delivery in one system.
See how companies are using this feature
Generate a comprehensive report showing department attendance rates and satisfaction scores for wellness programs to optimize next quarter's budget distribution.
Explore more features that work great together
Start using Analytics & Reports today with a 14-day free trial